Fintech · 2026
PREDICTA
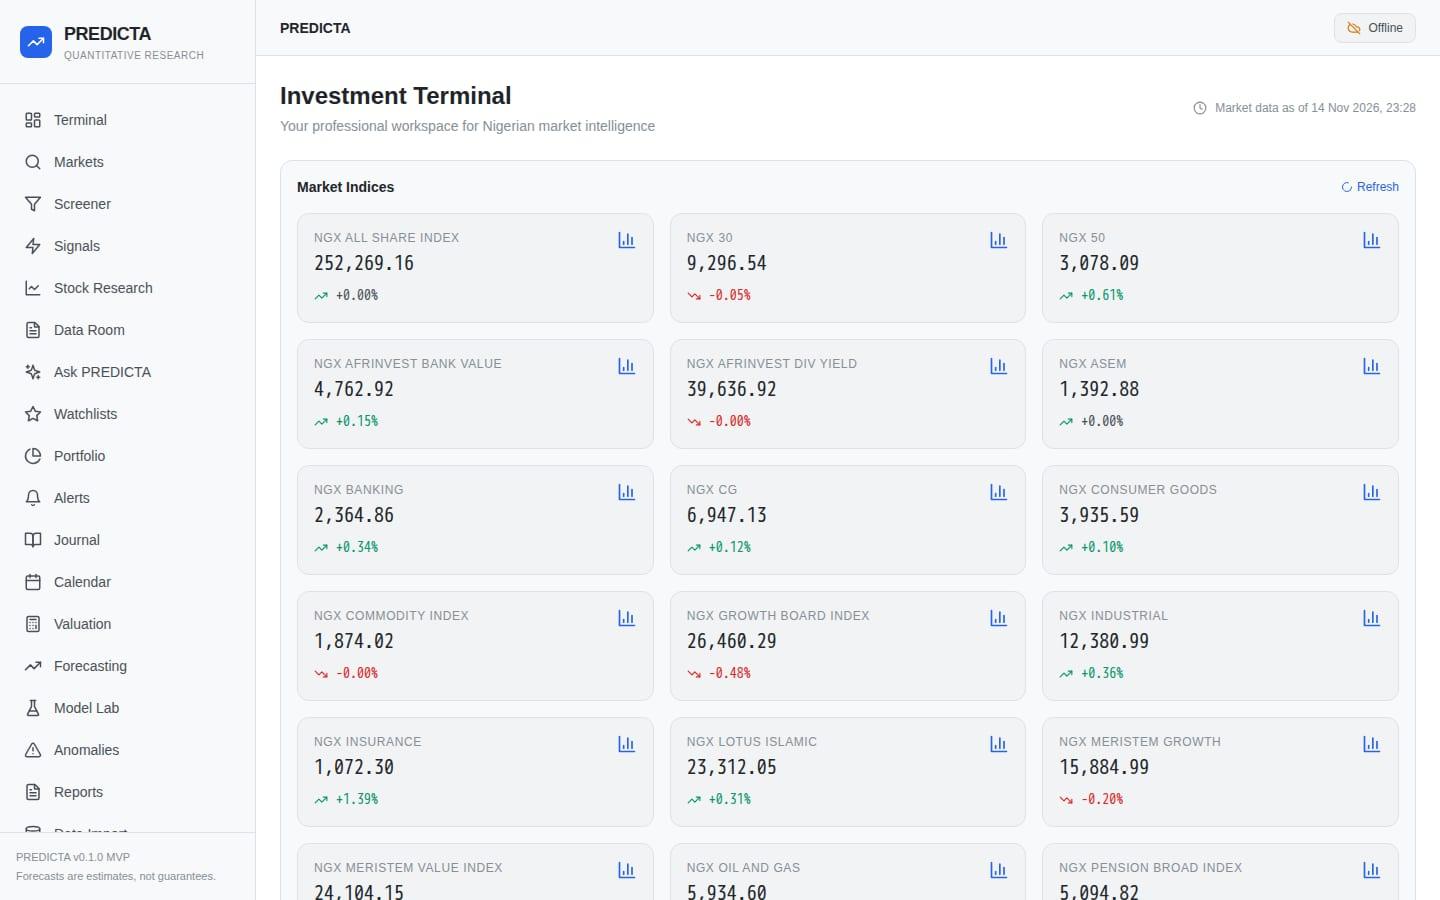
A stock research workspace for the Nigerian Exchange, with exploration, screening, forecasting and backtesting, and the data source always visible.
- Role
- Solo build: product design, front end, forecasting engine, API proxy
- Stack
- React 18 · TypeScript · Vite · Express · Supabase · Investo NGX API
- Year
- 2026
- Status
- Deployed and publicly reachable. Real NGX data requires an Investo API key; demo mode works without one.
Purpose
Retail research on the NGX is scattered across screenshots, spreadsheets and hearsay. PREDICTA pulls market data into one workspace where a stock can be explored, screened, forecast and then honestly evaluated, including when the forecast is wrong.
What was built
- Stock explorer across 146 NGX equities with price history charts
- Screener with volatility, return and data-quality filters
- Market movers: gainers, losers, most active, highest volatility
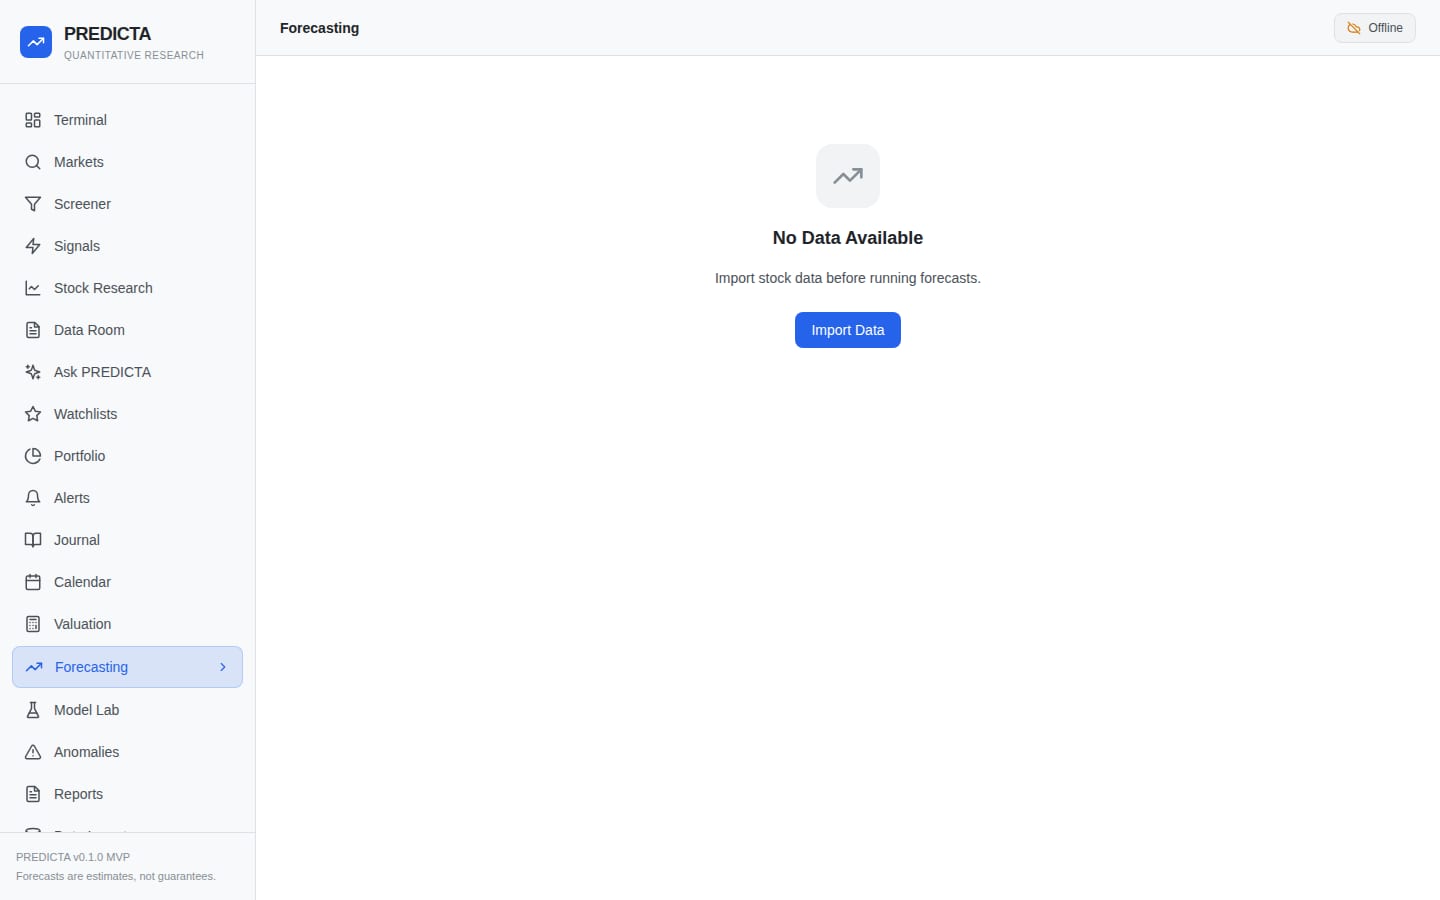
- Forecasting workspace with five models, from persistence to gradient boosting
- Model laboratory running walk-forward backtests with chronological splits
- Anomaly detection on unusual price and volume behaviour
- Portfolio tracker, valuation workbench and investment journal
- Watchlists, alerts and an investment calendar
- CSV import for your own datasets, plus a clearly labelled synthetic demo mode
- Email/password and OAuth sign-in with per-user data isolation
Decisions
Uncertainty is part of the interface
Forecasts are presented with approximate intervals and a visible model name, and the README documents the rules the engine follows: chronological train/test separation, no data leakage, and clear provenance for every dataset. A forecast that hides its source is worse than no forecast.
Keys never reach the browser
The Investo API is called through a small Express proxy rather than from client code, so the API key stays server-side and requests can be cached. The front end only ever talks to the proxy.
Demo data is labelled as demo data
The app supports three data sources (live NGX, CSV import and synthetic sample data) and tags whichever one is active, so a chart is never silently invented.
Questions about this project? Email me.